
Web Map Link: Click Here!
This project was created for the unit on Remote Sensing in my Geographic Information and Mapping II course last year. For this project, we were provided satellite images of different urban centers accross the globe and were expected to create I created an interactive web map of the distribution of NDVI values across the city. I chose the city of Paris for my project.
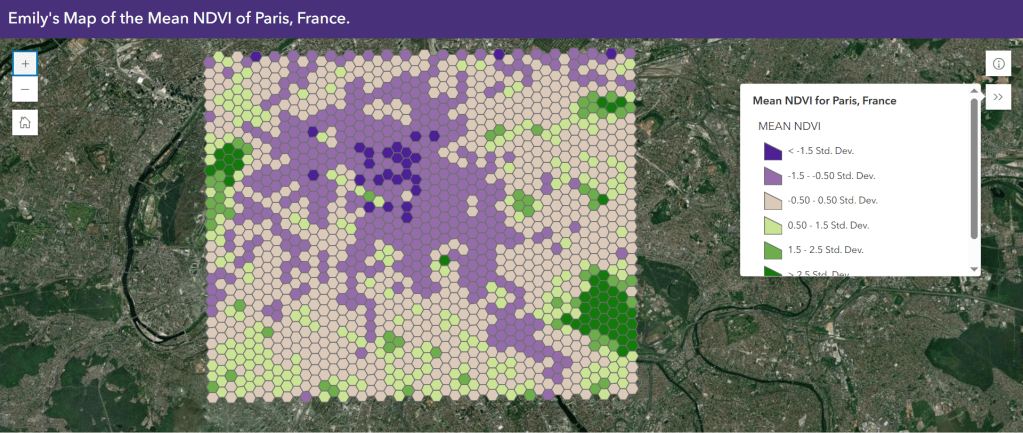
The Normalized Difference Vegetation Index (NDVI) is a measure used to illustrate the health of vegetation. Plants absorb much red light, and reflect a lot of near infrared light. These two bands of light were used to calculate the mean NDVI for each hexagonal cell in this map.
Values below -1 are non-vegetated surfaces, such as water or buildings. Values near 0 are bare soil or stressed vegetation. Values between 0.3-0.6 are moderately healthy, and anything above 0.6 is very healthy.
This map was created to identify if and where built spaces hinder the health of urban vegetation in Paris. Urban vegetation is essential for the provision of ecosystem services, which are the direct and indirect benefits that ecosystems offer for human life.
Visualizing the spatial relationship between built spaces and urban vegetation health can help city planners identify the regions where changes must be made to protect or increase vegetations levels.
This project was really cool to work on! I greatly enjoyed constructing the interactive component of the map, and look forward to learning how to create my own webmaps from code later in my degree.

Leave a comment