
Below are a few of the maps I created for a recent GIS research project examining port activity and recent port infrastructure renewal projects announced by the Carney government.
This project was completed for my Advanced Geographic Information Systems course and used open source data to answer a research question of interest. After hearing that the Major Projects office (MPO) will review three new port infrastructure upgrade projects, I chose to examine the geographic and economic factors contributing to the long-term prosperity of port regions in Canada.
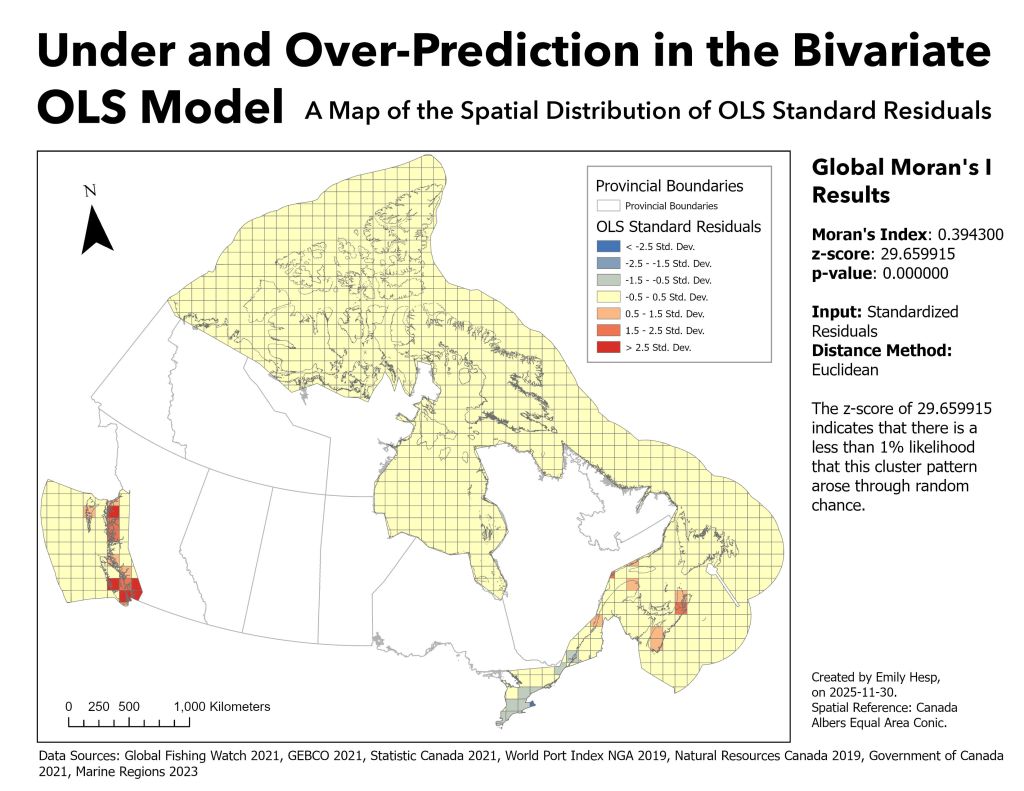
Using vessel pressence data as a proxy for port activity, this project applied spatial clustering and spatial regression methods to explore relationshps between port activity and the four explanatory variables identified in Table 1. Since multicollinearity was found among the some of the explanatory variables, transport polyline density was the only explanatory variable used in the final spatial regression model.
Table 1: Variables and Geographic Unit Used in the exploratory analysis
| Variable Type | Variable Description |
| Independent Variable | Z-Score of vessel count per grid cell |
| Dependent Variable 1 | Z-Score of port count per grid cell |
| Dependent Variable 2 | Z-Score of transport polyline density per grid cell |
| Dependent Variable 3 | Z-Score of mean GDP by CMA per grid cell |
| Dependent Variable 4 | Z-score of mean depth per grid cell |
| Geographic Unit | Square grid tessellation, 10,000 square kilometers |
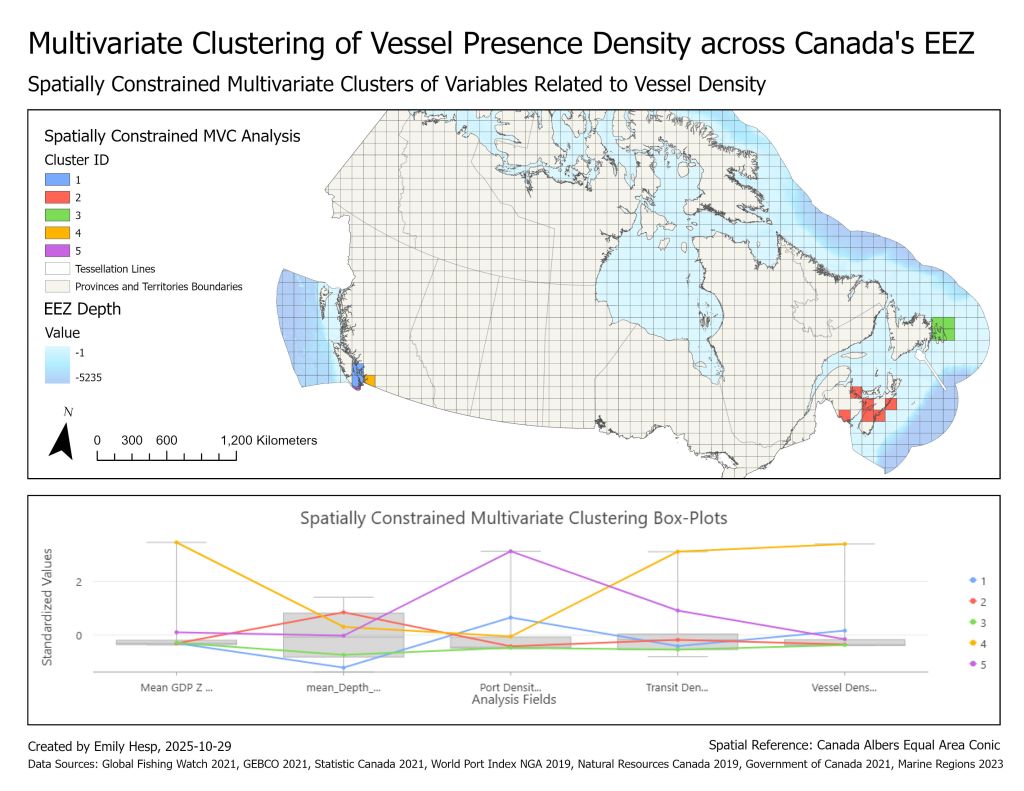
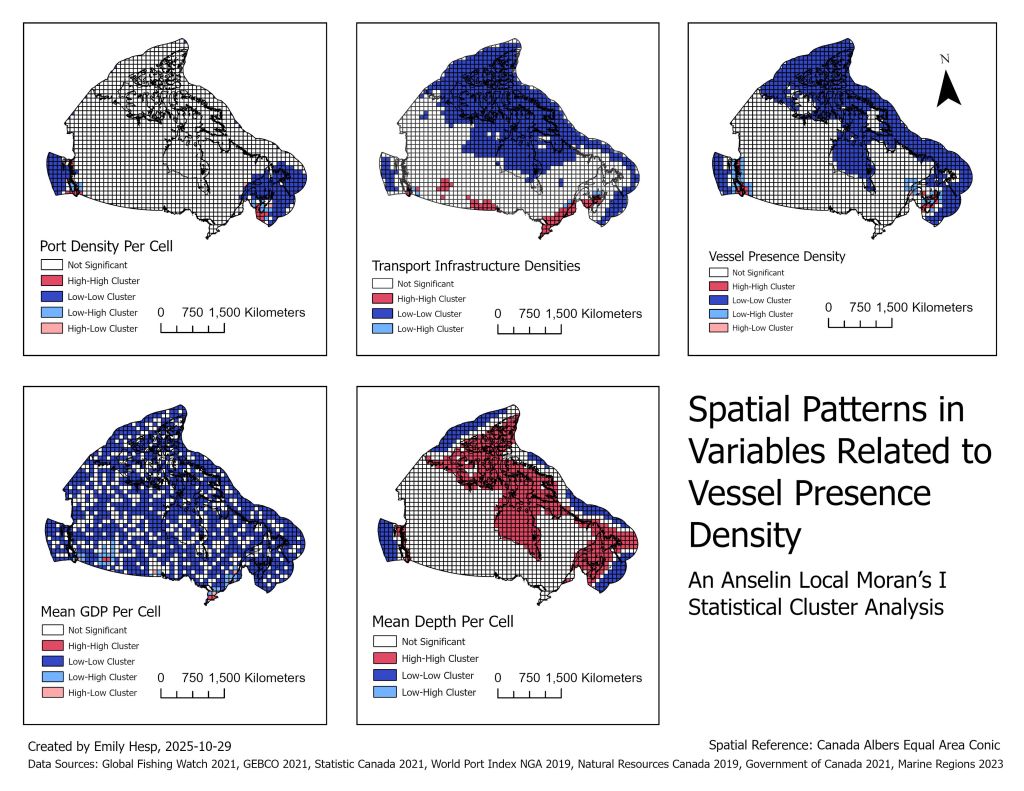
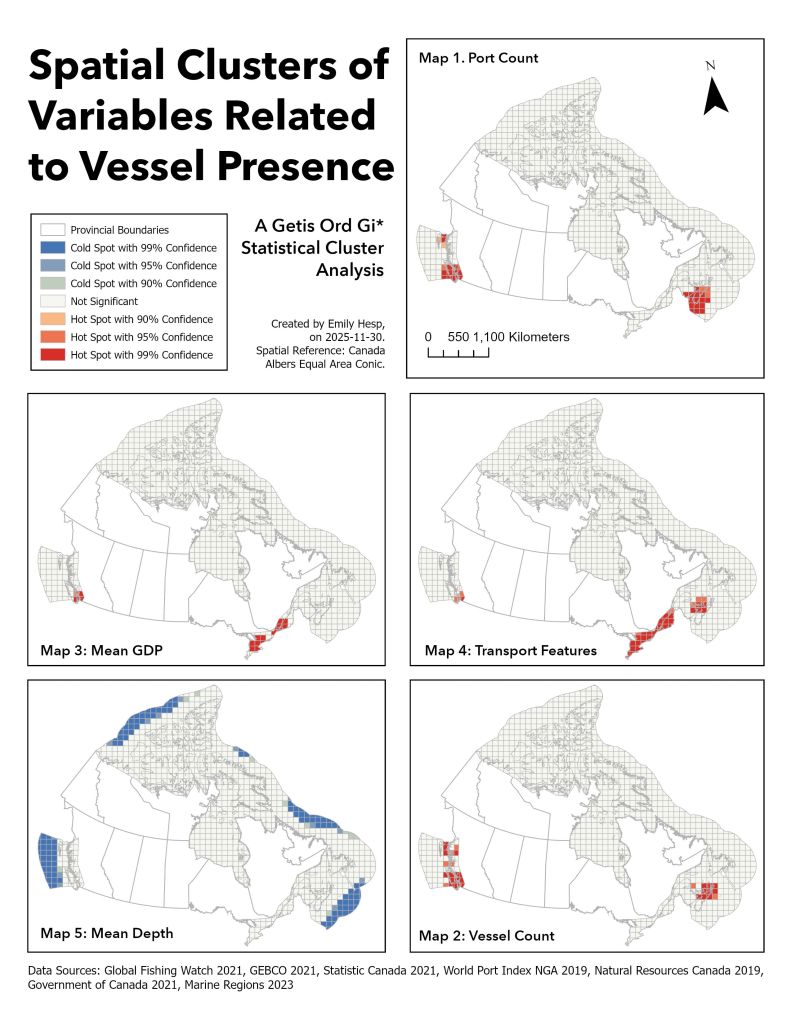
Table 2: Variables and Geographic Unit Used in the Final Report
| Variable Type | Variable Description |
| Independent Variable | Z-Score of vessel count per grid cell |
| Dependent Variable | Z-Score of transport polyline density per grid cell |
| Geographic Unit | Square grid tessellation, 10,000 square kilometers |
I plan to submit this paper to a student journal this semester and will link the final version here, after it is published.

Leave a comment